Introduction to table data and pandas
Table data is ubiquitous in various fields, ranging from finance to scientific research. They are presented in the form of tables where rows represent individual records and columns represent attributes or variables. Manipulating this data effectively is essential to extract meaningful information and make informed decisions.
Pandas is a powerful and flexible Python library specifically designed for the manipulation and analysis of table data. It provides high-level data structures and tools to work with labeled or relational data in an intuitive and efficient manner.
Inspired by the official Pandas documentation, this interactive tutorial allows you to learn how to read and write data using the features of the Pandas library.
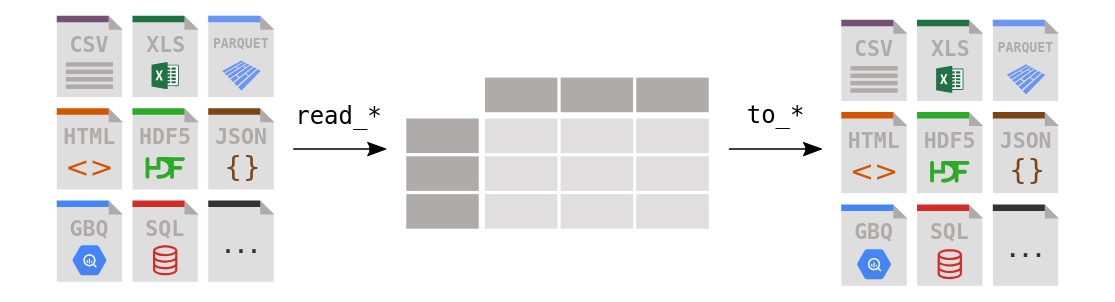
What is pandas?
Pandas provides two main data structures: DataFrames and Series. A DataFrame is a two-dimensional structure similar to a spreadsheet or a database table, while a Series is a one-dimensional structure similar to a column in a DataFrame.
Why use pandas?
- Ease of use: Simple and intuitive syntax.
- Performance: Optimized for fast processing of large amounts of data.
- Advanced features: Includes merging, grouping, pivoting operations, and much more.
With pandas, you can read, process, analyze, and visualize data efficiently, making it an indispensable tool for data scientists and analysts.
Reading CSV and Excel files with pandas
To start manipulating data with pandas, it's essential to know how to read common data files such as CSV and Excel files. Pandas simplifies this task with dedicated functions.
Reading CSV files
CSV (Comma-Separated Values) files are one of the most commonly used formats for storing table data. To read a CSV file with pandas, you can use the read_csv() function:
This function also allows for customizing the read with several parameters, such as the delimiter, headers, and columns to read.
Reading Excel files
Excel files are also very popular, especially in professional environments. Pandas offers the read_excel() function to read Excel files:
This function is very flexible and allows you to specify the sheet to read, manage headers, and read multiple sheets at once.
With these functions, pandas allows for easy integration of data from various sources, thus facilitating the start of your data analysis.
Exploring and visualizing data
Once the data is loaded into a DataFrame, the next step is to explore and visualize it to better understand its structure and content. Pandas offers many methods to perform these tasks.
Data exploration
To get a quick overview of the data, you can use the following methods:
head(): Displays the first few rows of the DataFrame.info(): Provides a concise summary of the DataFrame.describe(): Generates descriptive statistics for numeric columns.
Data visualization
For quick visualization, pandas integrates well with Matplotlib, a visualization library in Python. Here are some examples of common visualizations:
- Histograms:
df['column'].plot(kind='hist') - Bar charts:
df['column'].value_counts().plot(kind='bar') - Scatter plots:
df.plot(kind='scatter', x='column1', y='column2')
These tools allow you to discover patterns, trends, and anomalies in your data, thus facilitating a deeper analysis.
Data manipulation and cleaning
Data manipulation and cleaning are crucial steps to ensure the quality and relevance of your analysis. Pandas offers a comprehensive range of methods for these operations.
Data manipulation
Common manipulation operations include selecting, filtering, and transforming data:
- Column selection: Use
df['column'] to select a specific column. - Row filtering: Use conditions to filter rows, for example
df[df['column'] > value]. - Data transformation: Apply functions to an entire column with
df['column'].apply(function).
Data cleaning
Data cleaning aims to handle missing values, duplicates, and inconsistencies:
- Missing values: Use
df.dropna() to remove rows with missing values or df.fillna(value) to replace them. - Duplicates: Use
df.drop_duplicates() to remove duplicated rows. - Inconsistencies: Correct incorrect values or normalize formats.
These techniques ensure that your data is consistent and ready for analysis.
Exporting data in different formats
After cleaning and manipulating your data, you may want to export it to share or use it in other applications. Pandas makes this task easy by offering functions to export data in various formats.
Exporting to CSV
To save a DataFrame to a CSV file, use the to_csv() method:
The index=False parameter prevents including row indices in the CSV file.
Exporting to Excel
To export data to an Excel file, use the to_excel() method:
You can specify the sheet name with sheet_name and avoid including indices with index=False.
Exporting to JSON
The JSON format is very useful for data exchanges between web applications. Use to_json() to export your data:
The orient='records' parameter structures the data into lists of dictionaries, and lines=True allows saving each record on a separate line.
These pandas export methods allow you to easily save and share your data in different formats suited to your needs.